Skip to content

Spectral

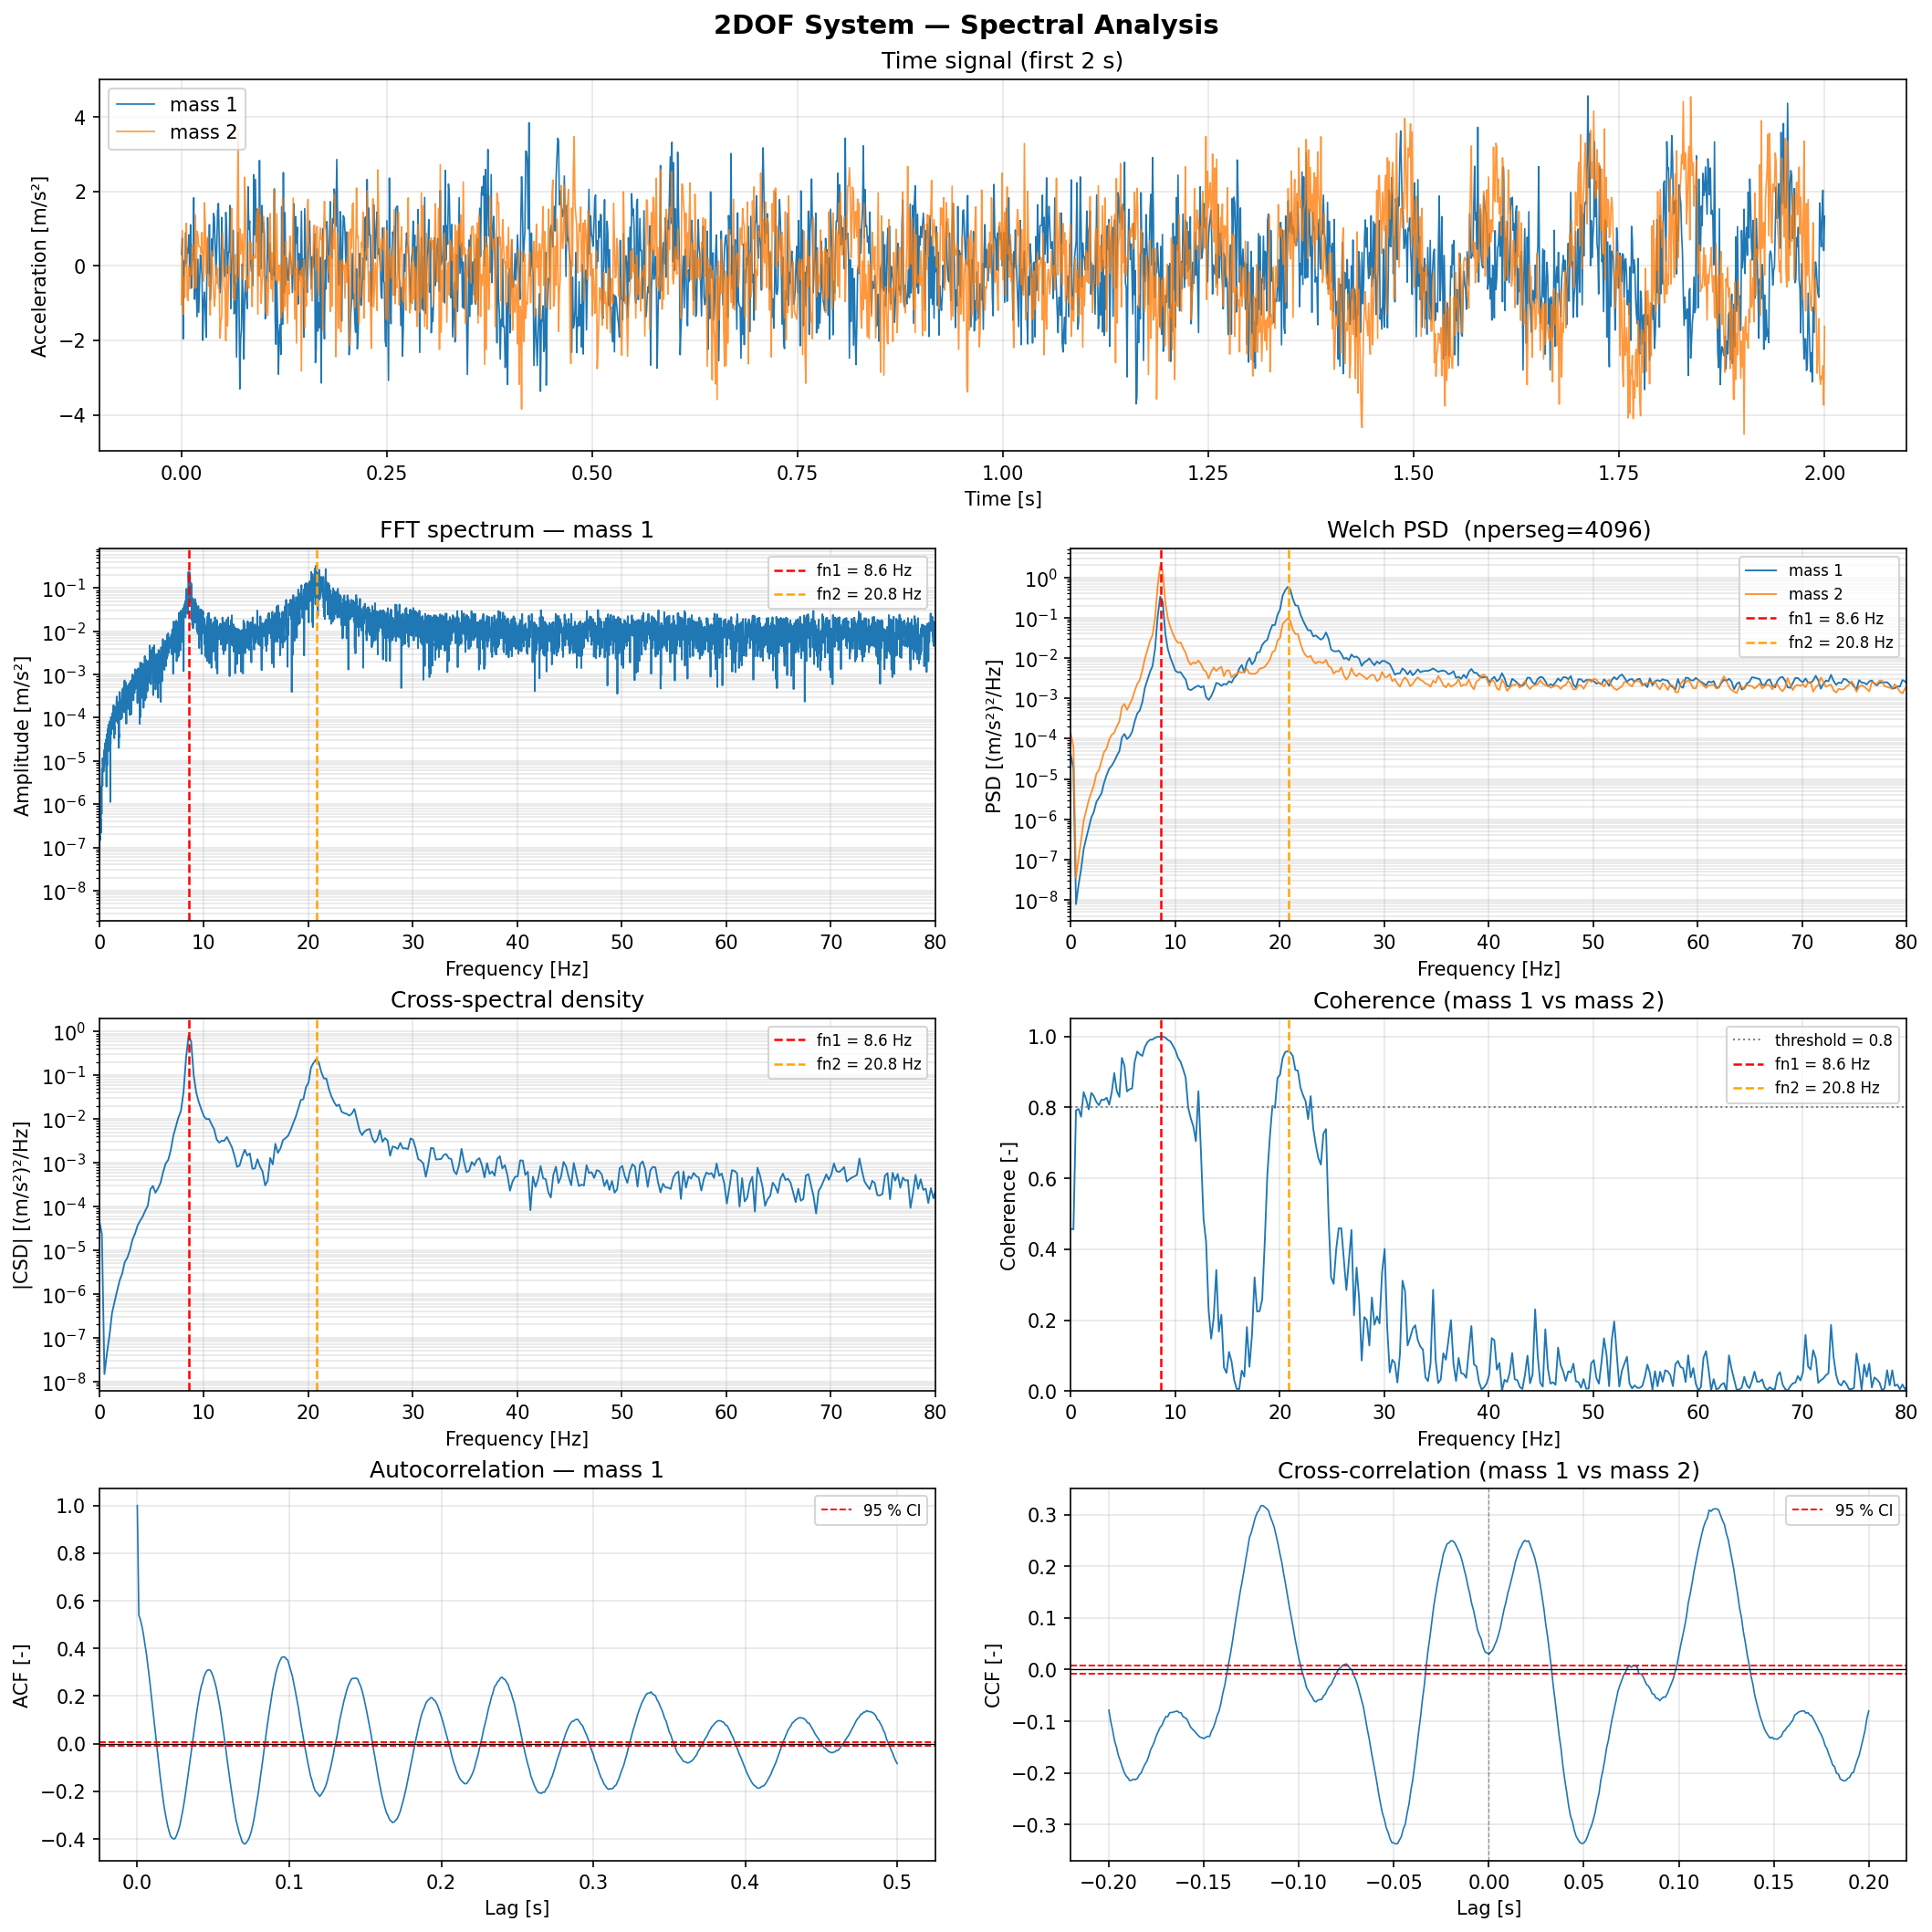
Spectral analysis functions: FFT amplitude spectrum, power spectral density, cross-spectral density, coherence, autocorrelation, and cross-correlation.

All estimators use scipy.signal under the hood with engineering-friendly defaults (Hann window, density scaling, mean detrending).

Spectral analysis example


dspkit.spectral.fft_spectrum(x, fs, window='hann', scaling='amplitude')

Single-sided FFT amplitude spectrum with window amplitude correction.

For a pure sine of amplitude A at frequency f, the returned spectrum will show A at that frequency bin (with scaling='amplitude').

Parameters:

Name Type Description Default
x (array_like, shape(N))

Time-domain signal.

required
fs float

Sampling frequency [Hz].

required
window str or None

Window function name accepted by scipy.signal.get_window. None uses a rectangular window (no windowing).

'hann'
scaling (amplitude, rms)

'amplitude' returns peak amplitude per bin. 'rms' returns RMS amplitude (peak / sqrt(2)), useful for comparing sinusoidal components with broadband levels.

'amplitude'

Returns:

Name Type Description
freqs (ndarray, shape(N // 2 + 1))

Frequency vector [Hz].

amplitude (ndarray, shape(N // 2 + 1))

Amplitude spectrum in the same units as x.

Source code in dspkit/spectral.py
def fft_spectrum(
    x: np.ndarray,
    fs: float,
    window: str | None = "hann",
    scaling: Literal["amplitude", "rms"] = "amplitude",
) -> tuple[np.ndarray, np.ndarray]:
    """
    Single-sided FFT amplitude spectrum with window amplitude correction.

    For a pure sine of amplitude A at frequency f, the returned spectrum will
    show A at that frequency bin (with ``scaling='amplitude'``).

    Parameters
    ----------
    x : array_like, shape (N,)
        Time-domain signal.
    fs : float
        Sampling frequency [Hz].
    window : str or None
        Window function name accepted by ``scipy.signal.get_window``.
        ``None`` uses a rectangular window (no windowing).
    scaling : {'amplitude', 'rms'}
        ``'amplitude'`` returns peak amplitude per bin.
        ``'rms'`` returns RMS amplitude (peak / sqrt(2)), useful for
        comparing sinusoidal components with broadband levels.

    Returns
    -------
    freqs : ndarray, shape (N//2 + 1,)
        Frequency vector [Hz].
    amplitude : ndarray, shape (N//2 + 1,)
        Amplitude spectrum in the same units as ``x``.
    """
    x = np.asarray(x, dtype=float)
    N = len(x)

    if window is not None:
        win = _signal.get_window(window, N)
        # Amplitude correction: scale so that a sine's peak is preserved
        acf = N / win.sum()
        x = x * win
    else:
        acf = 1.0

    X = np.fft.rfft(x)
    freqs = np.fft.rfftfreq(N, d=1.0 / fs)

    amplitude = np.abs(X) * acf / N
    # Double interior bins to account for the discarded negative-frequency mirror
    amplitude[1:-1] *= 2.0

    if scaling == "rms":
        amplitude /= np.sqrt(2.0)

    return freqs, amplitude

dspkit.spectral.psd(x, fs, window='hann', nperseg=None, noverlap=None, scaling='density', detrend='constant')

Power spectral density (or power spectrum) via Welch's method.

Parameters:

Name Type Description Default
x (array_like, shape(N))

Time-domain signal.

required
fs float

Sampling frequency [Hz].

required
window str

Window function (default 'hann').

'hann'
nperseg int or None

Segment length. Defaults to min(len(x), 1024).

None
noverlap int or None

Number of overlapping samples between segments. Defaults to nperseg // 2 (50 % overlap).

None
scaling (density, spectrum)

'density' → PSD [units²/Hz]. 'spectrum' → power spectrum [units²].

'density'
detrend str or False

Detrending applied to each segment before windowing. 'constant' removes the mean, 'linear' removes a linear trend, False skips detrending.

'constant'

Returns:

Name Type Description
freqs ndarray

Frequency vector [Hz].

Pxx ndarray

One-sided PSD or power spectrum (real, non-negative).

Source code in dspkit/spectral.py
def psd(
    x: np.ndarray,
    fs: float,
    window: str = "hann",
    nperseg: int | None = None,
    noverlap: int | None = None,
    scaling: Literal["density", "spectrum"] = "density",
    detrend: str | Literal[False] = "constant",
) -> tuple[np.ndarray, np.ndarray]:
    """
    Power spectral density (or power spectrum) via Welch's method.

    Parameters
    ----------
    x : array_like, shape (N,)
        Time-domain signal.
    fs : float
        Sampling frequency [Hz].
    window : str
        Window function (default ``'hann'``).
    nperseg : int or None
        Segment length. Defaults to ``min(len(x), 1024)``.
    noverlap : int or None
        Number of overlapping samples between segments.
        Defaults to ``nperseg // 2`` (50 % overlap).
    scaling : {'density', 'spectrum'}
        ``'density'`` → PSD [units²/Hz].
        ``'spectrum'`` → power spectrum [units²].
    detrend : str or False
        Detrending applied to each segment before windowing.
        ``'constant'`` removes the mean, ``'linear'`` removes a linear trend,
        ``False`` skips detrending.

    Returns
    -------
    freqs : ndarray
        Frequency vector [Hz].
    Pxx : ndarray
        One-sided PSD or power spectrum (real, non-negative).
    """
    x = np.asarray(x, dtype=float)
    if nperseg is None:
        nperseg = min(len(x), 1024)

    freqs, Pxx = _signal.welch(
        x,
        fs=fs,
        window=window,
        nperseg=nperseg,
        noverlap=noverlap,
        scaling=scaling,
        detrend=detrend,
    )
    return freqs, Pxx

dspkit.spectral.csd(x, y, fs, window='hann', nperseg=None, noverlap=None, detrend='constant')

Cross-spectral density via Welch's method.

Gxy(f) = E[X*(f) Y(f)] / Hz, where X, Y are the DFTs of x and y.

Parameters:

Name Type Description Default
x (array_like, shape(N))

Input signals. They must have the same sampling frequency.

required
y (array_like, shape(N))

Input signals. They must have the same sampling frequency.

required
fs float

Sampling frequency [Hz].

required
window str

Window function (default 'hann').

'hann'
nperseg int or None

Segment length. Defaults to min(len(x), len(y), 1024).

None
noverlap int or None

Overlapping samples. Defaults to nperseg // 2.

None
detrend str or False

Per-segment detrending (see psd).

'constant'

Returns:

Name Type Description
freqs ndarray

Frequency vector [Hz].

Pxy ndarray(complex)

One-sided cross-spectral density [units_x · units_y / Hz].

Source code in dspkit/spectral.py
def csd(
    x: np.ndarray,
    y: np.ndarray,
    fs: float,
    window: str = "hann",
    nperseg: int | None = None,
    noverlap: int | None = None,
    detrend: str | Literal[False] = "constant",
) -> tuple[np.ndarray, np.ndarray]:
    """
    Cross-spectral density via Welch's method.

    Gxy(f) = E[X*(f) Y(f)] / Hz,  where X, Y are the DFTs of x and y.

    Parameters
    ----------
    x, y : array_like, shape (N,)
        Input signals. They must have the same sampling frequency.
    fs : float
        Sampling frequency [Hz].
    window : str
        Window function (default ``'hann'``).
    nperseg : int or None
        Segment length. Defaults to ``min(len(x), len(y), 1024)``.
    noverlap : int or None
        Overlapping samples. Defaults to ``nperseg // 2``.
    detrend : str or False
        Per-segment detrending (see `psd`).

    Returns
    -------
    freqs : ndarray
        Frequency vector [Hz].
    Pxy : ndarray (complex)
        One-sided cross-spectral density [units_x · units_y / Hz].
    """
    x = np.asarray(x, dtype=float)
    y = np.asarray(y, dtype=float)
    if nperseg is None:
        nperseg = min(len(x), len(y), 1024)

    freqs, Pxy = _signal.csd(
        x,
        y,
        fs=fs,
        window=window,
        nperseg=nperseg,
        noverlap=noverlap,
        detrend=detrend,
    )
    return freqs, Pxy

dspkit.spectral.coherence(x, y, fs, window='hann', nperseg=None, noverlap=None, detrend='constant')

Magnitude-squared coherence between x and y.

Cxy(f) = |Gxy(f)|² / (Gxx(f) · Gyy(f)), values in [0, 1].

A value near 1 means the two signals are linearly related at that frequency. A value near 0 indicates noise or nonlinearity.

Parameters:

Name Type Description Default
x (array_like, shape(N))
required
y (array_like, shape(N))
required
fs float

Sampling frequency [Hz].

required
window str

Window function (default 'hann').

'hann'
nperseg int or None

Segment length. Defaults to min(len(x), len(y), 1024).

None
noverlap int or None

Overlapping samples. Defaults to nperseg // 2.

None
detrend str or False

Per-segment detrending.

'constant'

Returns:

Name Type Description
freqs ndarray
Cxy ndarray

Magnitude-squared coherence, values in [0, 1].

Source code in dspkit/spectral.py
def coherence(
    x: np.ndarray,
    y: np.ndarray,
    fs: float,
    window: str = "hann",
    nperseg: int | None = None,
    noverlap: int | None = None,
    detrend: str | Literal[False] = "constant",
) -> tuple[np.ndarray, np.ndarray]:
    """
    Magnitude-squared coherence between x and y.

    Cxy(f) = |Gxy(f)|² / (Gxx(f) · Gyy(f)),  values in [0, 1].

    A value near 1 means the two signals are linearly related at that frequency.
    A value near 0 indicates noise or nonlinearity.

    Parameters
    ----------
    x, y : array_like, shape (N,)
    fs : float
        Sampling frequency [Hz].
    window : str
        Window function (default ``'hann'``).
    nperseg : int or None
        Segment length. Defaults to ``min(len(x), len(y), 1024)``.
    noverlap : int or None
        Overlapping samples. Defaults to ``nperseg // 2``.
    detrend : str or False
        Per-segment detrending.

    Returns
    -------
    freqs : ndarray
    Cxy : ndarray
        Magnitude-squared coherence, values in [0, 1].
    """
    x = np.asarray(x, dtype=float)
    y = np.asarray(y, dtype=float)
    if nperseg is None:
        nperseg = min(len(x), len(y), 1024)

    freqs, Cxy = _signal.coherence(
        x,
        y,
        fs=fs,
        window=window,
        nperseg=nperseg,
        noverlap=noverlap,
        detrend=detrend,
    )
    return freqs, Cxy

dspkit.spectral.autocorrelation(x, fs=None, normalize=True, max_lag=None)

Biased autocorrelation function (ACF) via FFT.

Uses the biased estimator (divides by N, not N-k) for better variance behaviour at large lags.

Parameters:

Name Type Description Default
x (array_like, shape(N))

Input signal (zero-mean recommended; detrend first if needed).

required
fs float or None

Sampling frequency [Hz]. If provided, the lag axis is in seconds; otherwise it is in samples.

None
normalize bool

If True (default), normalise so that ACF[0] = 1.

True
max_lag float or None

Maximum lag to return. Interpreted in seconds if fs is given, otherwise in samples. Defaults to the full one-sided ACF.

None

Returns:

Name Type Description
lags ndarray

Lag axis (seconds if fs given, else samples).

acf ndarray

Autocorrelation values.

Source code in dspkit/spectral.py
def autocorrelation(
    x: np.ndarray,
    fs: float | None = None,
    normalize: bool = True,
    max_lag: float | None = None,
) -> tuple[np.ndarray, np.ndarray]:
    """
    Biased autocorrelation function (ACF) via FFT.

    Uses the biased estimator (divides by N, not N-k) for better
    variance behaviour at large lags.

    Parameters
    ----------
    x : array_like, shape (N,)
        Input signal (zero-mean recommended; detrend first if needed).
    fs : float or None
        Sampling frequency [Hz]. If provided, the lag axis is in seconds;
        otherwise it is in samples.
    normalize : bool
        If ``True`` (default), normalise so that ACF[0] = 1.
    max_lag : float or None
        Maximum lag to return. Interpreted in seconds if ``fs`` is given,
        otherwise in samples. Defaults to the full one-sided ACF.

    Returns
    -------
    lags : ndarray
        Lag axis (seconds if ``fs`` given, else samples).
    acf : ndarray
        Autocorrelation values.
    """
    x = np.asarray(x, dtype=float)
    N = len(x)

    # FFT-based circular correlation then truncate to causal (positive) lags
    Xf = np.fft.rfft(x, n=2 * N)
    acf_full = np.fft.irfft(Xf * np.conj(Xf))[:N]

    if normalize:
        acf_full = acf_full / acf_full[0]
    else:
        acf_full = acf_full / N

    lags = np.arange(N) / fs if fs is not None else np.arange(N, dtype=float)

    if max_lag is not None:
        cutoff = int(max_lag * fs) + 1 if fs is not None else int(max_lag) + 1
        lags = lags[:cutoff]
        acf_full = acf_full[:cutoff]

    return lags, acf_full

dspkit.spectral.cross_correlation(x, y, fs=None, normalize=True, max_lag=None)

Biased cross-correlation function (CCF) via FFT.

Computes the full two-sided CCF with lags from -(N-1) to +(N-1):

CCF[k] = (1/N) Σ_n x[n] · y[n + k]

A positive peak at lag k > 0 means y leads x by k samples (i.e. x is a delayed version of y).

Parameters:

Name Type Description Default
x (array_like, shape(N))

Input signals. Must have the same length.

required
y (array_like, shape(N))

Input signals. Must have the same length.

required
fs float or None

Sampling frequency [Hz]. If provided, the lag axis is in seconds; otherwise it is in samples.

None
normalize bool

If True (default), normalise so that max |CCF| ≤ 1. Specifically divides by sqrt(Rxx[0] · Ryy[0]), giving the cross-correlation coefficient — the same convention as numpy.corrcoef.

True
max_lag float or None

Maximum absolute lag to return. Interpreted in seconds if fs is given, otherwise in samples.

None

Returns:

Name Type Description
lags ndarray

Symmetric lag axis, running from -max_lag to +max_lag (seconds if fs given, else samples).

ccf ndarray

Cross-correlation values.

Source code in dspkit/spectral.py
def cross_correlation(
    x: np.ndarray,
    y: np.ndarray,
    fs: float | None = None,
    normalize: bool = True,
    max_lag: float | None = None,
) -> tuple[np.ndarray, np.ndarray]:
    """
    Biased cross-correlation function (CCF) via FFT.

    Computes the full two-sided CCF with lags from -(N-1) to +(N-1):

        CCF[k] = (1/N) Σ_n x[n] · y[n + k]

    A positive peak at lag k > 0 means y leads x by k samples (i.e. x is a
    delayed version of y).

    Parameters
    ----------
    x, y : array_like, shape (N,)
        Input signals. Must have the same length.
    fs : float or None
        Sampling frequency [Hz]. If provided, the lag axis is in seconds;
        otherwise it is in samples.
    normalize : bool
        If ``True`` (default), normalise so that ``max |CCF| ≤ 1``.
        Specifically divides by ``sqrt(Rxx[0] · Ryy[0])``, giving the
        cross-correlation coefficient — the same convention as
        ``numpy.corrcoef``.
    max_lag : float or None
        Maximum absolute lag to return. Interpreted in seconds if ``fs``
        is given, otherwise in samples.

    Returns
    -------
    lags : ndarray
        Symmetric lag axis, running from ``-max_lag`` to ``+max_lag``
        (seconds if ``fs`` given, else samples).
    ccf : ndarray
        Cross-correlation values.
    """
    x = np.asarray(x, dtype=float)
    y = np.asarray(y, dtype=float)
    N = len(x)

    Xf = np.fft.fft(x, n=2 * N)
    Yf = np.fft.fft(y, n=2 * N)
    ccf_raw = np.fft.ifft(np.conj(Xf) * Yf).real

    # Rearrange to two-sided: lags -(N-1) … 0 … +(N-1)
    ccf_two = np.concatenate([ccf_raw[-(N - 1):], ccf_raw[:N]])

    if normalize:
        norm = np.sqrt(np.dot(x, x) * np.dot(y, y))
        if norm > 0:
            ccf_two = ccf_two / norm
    else:
        ccf_two = ccf_two / N

    lags_samples = np.arange(-(N - 1), N, dtype=float)
    lags = lags_samples / fs if fs is not None else lags_samples

    if max_lag is not None:
        cutoff = int(max_lag * fs) if fs is not None else int(max_lag)
        mask = np.abs(lags_samples) <= cutoff
        lags = lags[mask]
        ccf_two = ccf_two[mask]

    return lags, ccf_two