Skip to content

SHM Indicators

Lightweight signal-derived features for damage detection, condition monitoring, and trend analysis.

SHM indicators example


dspkit.indicators.spectral_entropy(freqs, Pxx)

Normalised Shannon entropy of a power spectrum.

A value near 1.0 indicates a flat (white noise-like) spectrum. A value near 0.0 indicates energy concentrated at very few frequencies (highly tonal / narrow-band).

Parameters:

Name Type Description Default
freqs (array_like, shape(M))

Frequency vector [Hz] (used only for validation; not consumed).

required
Pxx (array_like, shape(M))

Power spectral density or power spectrum (non-negative).

required

Returns:

Type Description
float

Spectral entropy in [0, 1].

Source code in dspkit/indicators.py
def spectral_entropy(
    freqs: np.ndarray,
    Pxx: np.ndarray,
) -> float:
    """
    Normalised Shannon entropy of a power spectrum.

    A value near 1.0 indicates a flat (white noise-like) spectrum.
    A value near 0.0 indicates energy concentrated at very few frequencies
    (highly tonal / narrow-band).

    Parameters
    ----------
    freqs : array_like, shape (M,)
        Frequency vector [Hz] (used only for validation; not consumed).
    Pxx : array_like, shape (M,)
        Power spectral density or power spectrum (non-negative).

    Returns
    -------
    float
        Spectral entropy in [0, 1].
    """
    Pxx = np.asarray(Pxx, dtype=float)
    Pxx = np.maximum(Pxx, 0.0)
    total = Pxx.sum()
    if total == 0:
        return 0.0
    p = Pxx / total
    # Avoid log(0) by masking zeros
    nonzero = p > 0
    H = -np.sum(p[nonzero] * np.log(p[nonzero]))
    H_max = np.log(len(p))
    return float(H / H_max) if H_max > 0 else 0.0

dspkit.indicators.kurtosis(x, excess=True)

Kurtosis (fourth standardised moment) of a signal.

High kurtosis indicates heavy tails / impulsive content. Normal distribution has excess kurtosis = 0 (regular kurtosis = 3).

Parameters:

Name Type Description Default
x (array_like, shape(N))
required
excess bool

If True (default), return excess kurtosis (subtract 3). If False, return the regular (non-excess) kurtosis.

True

Returns:

Type Description
float
Source code in dspkit/indicators.py
def kurtosis(x: np.ndarray, excess: bool = True) -> float:
    """
    Kurtosis (fourth standardised moment) of a signal.

    High kurtosis indicates heavy tails / impulsive content.
    Normal distribution has excess kurtosis = 0 (regular kurtosis = 3).

    Parameters
    ----------
    x : array_like, shape (N,)
    excess : bool
        If ``True`` (default), return excess kurtosis (subtract 3).
        If ``False``, return the regular (non-excess) kurtosis.

    Returns
    -------
    float
    """
    x = np.asarray(x, dtype=float)
    m = x.mean()
    s = x.std()
    if s == 0:
        return 0.0
    k = float(np.mean(((x - m) / s) ** 4))
    return k - 3.0 if excess else k

dspkit.indicators.skewness(x)

Skewness (third standardised moment) of a signal.

Positive skewness means the tail on the right side is longer. Zero skewness for a symmetric distribution.

Parameters:

Name Type Description Default
x (array_like, shape(N))
required

Returns:

Type Description
float
Source code in dspkit/indicators.py
def skewness(x: np.ndarray) -> float:
    """
    Skewness (third standardised moment) of a signal.

    Positive skewness means the tail on the right side is longer.
    Zero skewness for a symmetric distribution.

    Parameters
    ----------
    x : array_like, shape (N,)

    Returns
    -------
    float
    """
    x = np.asarray(x, dtype=float)
    m = x.mean()
    s = x.std()
    if s == 0:
        return 0.0
    return float(np.mean(((x - m) / s) ** 3))

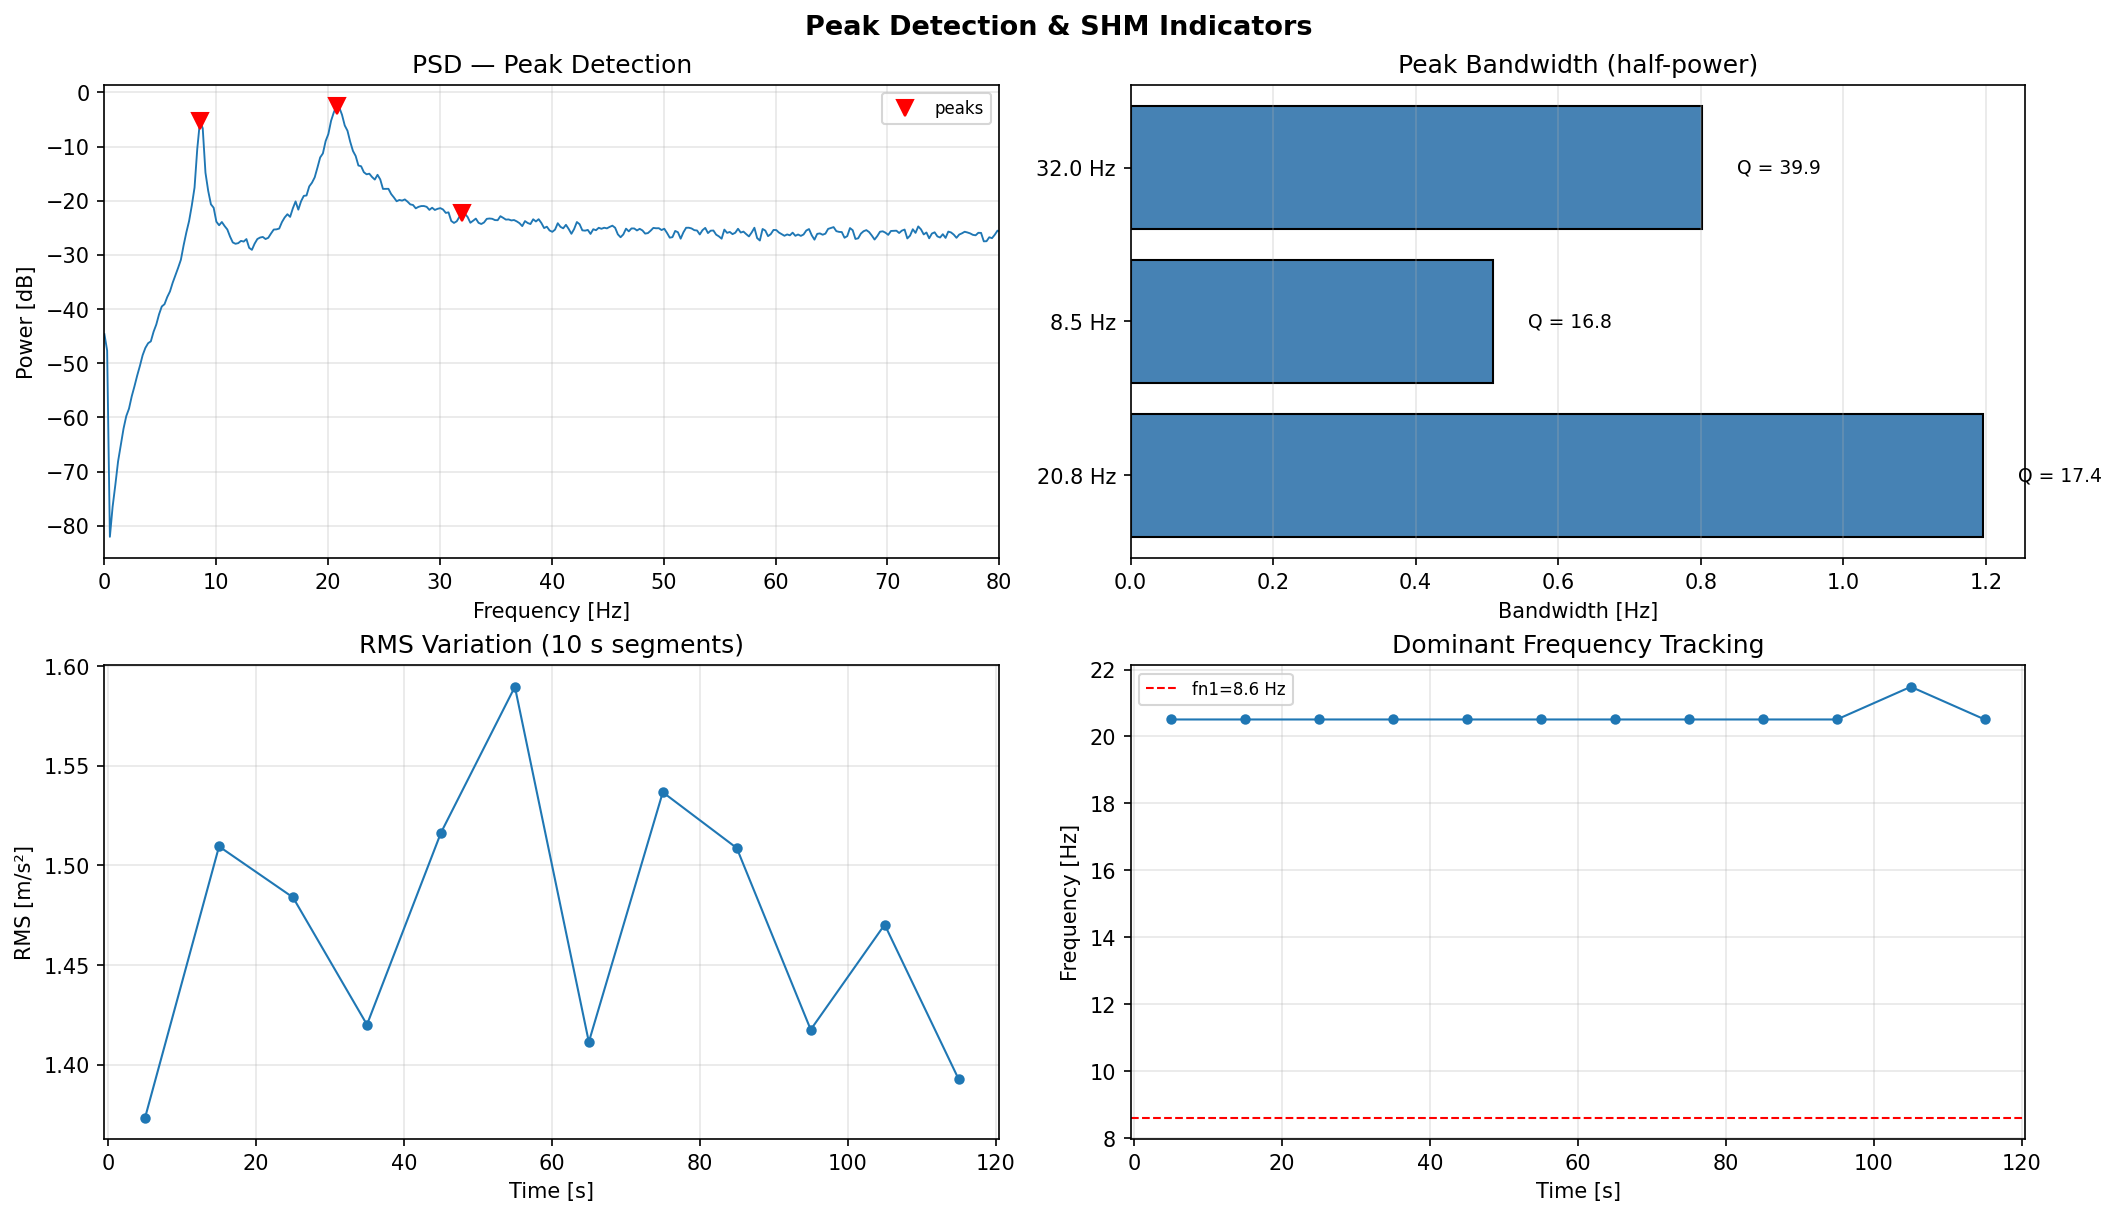
dspkit.indicators.rms_variation(x, fs, segment_duration=None)

RMS level computed over consecutive non-overlapping segments.

Useful for tracking amplitude changes over time (e.g. damage progression).

Parameters:

Name Type Description Default
x (array_like, shape(N))
required
fs float

Sampling frequency [Hz].

required
segment_duration float or None

Duration of each segment [s]. Defaults to len(x) / fs / 10 (ten segments).

None

Returns:

Name Type Description
times ndarray

Centre time of each segment [s].

rms_values ndarray

RMS value per segment.

Source code in dspkit/indicators.py
def rms_variation(
    x: np.ndarray,
    fs: float,
    segment_duration: float | None = None,
) -> tuple[np.ndarray, np.ndarray]:
    """
    RMS level computed over consecutive non-overlapping segments.

    Useful for tracking amplitude changes over time (e.g. damage progression).

    Parameters
    ----------
    x : array_like, shape (N,)
    fs : float
        Sampling frequency [Hz].
    segment_duration : float or None
        Duration of each segment [s]. Defaults to ``len(x) / fs / 10``
        (ten segments).

    Returns
    -------
    times : ndarray
        Centre time of each segment [s].
    rms_values : ndarray
        RMS value per segment.
    """
    x = np.asarray(x, dtype=float)
    N = len(x)

    if segment_duration is None:
        segment_duration = N / fs / 10.0
    seg_len = max(1, int(segment_duration * fs))

    n_segments = N // seg_len
    if n_segments == 0:
        return np.array([N / (2.0 * fs)]), np.array([np.sqrt(np.mean(x**2))])

    x_trimmed = x[: n_segments * seg_len].reshape(n_segments, seg_len)
    rms_vals = np.sqrt(np.mean(x_trimmed**2, axis=1))
    times = (np.arange(n_segments) + 0.5) * seg_len / fs

    return times, rms_vals

dspkit.indicators.frequency_shift(x, fs, segment_duration=None, nperseg=None)

Track the dominant PSD frequency across consecutive segments.

A shift in the dominant frequency over time may indicate stiffness degradation or damage.

Parameters:

Name Type Description Default
x (array_like, shape(N))
required
fs float

Sampling frequency [Hz].

required
segment_duration float or None

Duration of each analysis segment [s]. Defaults to ten segments.

None
nperseg int or None

Welch PSD segment length within each analysis segment. Defaults to min(segment_samples, 1024).

None

Returns:

Name Type Description
times ndarray

Centre time of each segment [s].

dominant_freqs ndarray

Dominant (peak PSD) frequency per segment [Hz].

Source code in dspkit/indicators.py
def frequency_shift(
    x: np.ndarray,
    fs: float,
    segment_duration: float | None = None,
    nperseg: int | None = None,
) -> tuple[np.ndarray, np.ndarray]:
    """
    Track the dominant PSD frequency across consecutive segments.

    A shift in the dominant frequency over time may indicate stiffness
    degradation or damage.

    Parameters
    ----------
    x : array_like, shape (N,)
    fs : float
        Sampling frequency [Hz].
    segment_duration : float or None
        Duration of each analysis segment [s]. Defaults to ten segments.
    nperseg : int or None
        Welch PSD segment length within each analysis segment.
        Defaults to ``min(segment_samples, 1024)``.

    Returns
    -------
    times : ndarray
        Centre time of each segment [s].
    dominant_freqs : ndarray
        Dominant (peak PSD) frequency per segment [Hz].
    """
    x = np.asarray(x, dtype=float)
    N = len(x)

    if segment_duration is None:
        segment_duration = N / fs / 10.0
    seg_len = max(1, int(segment_duration * fs))

    n_segments = N // seg_len
    if n_segments == 0:
        n_segments = 1
        seg_len = N

    times = np.zeros(n_segments)
    dominant_freqs = np.zeros(n_segments)

    for i in range(n_segments):
        chunk = x[i * seg_len: (i + 1) * seg_len]
        nps = min(len(chunk), 1024) if nperseg is None else nperseg
        freqs, Pxx = _signal.welch(chunk, fs=fs, nperseg=nps)
        dominant_freqs[i] = freqs[np.argmax(Pxx)]
        times[i] = (i + 0.5) * seg_len / fs

    return times, dominant_freqs

dspkit.indicators.energy_variation(x, fs, segment_duration=None)

Signal energy (mean squared value) over consecutive segments.

Parameters:

Name Type Description Default
x (array_like, shape(N))
required
fs float

Sampling frequency [Hz].

required
segment_duration float or None

Duration of each segment [s]. Defaults to ten segments.

None

Returns:

Name Type Description
times ndarray

Centre time of each segment [s].

energies ndarray

Mean squared value per segment.

Source code in dspkit/indicators.py
def energy_variation(
    x: np.ndarray,
    fs: float,
    segment_duration: float | None = None,
) -> tuple[np.ndarray, np.ndarray]:
    """
    Signal energy (mean squared value) over consecutive segments.

    Parameters
    ----------
    x : array_like, shape (N,)
    fs : float
        Sampling frequency [Hz].
    segment_duration : float or None
        Duration of each segment [s]. Defaults to ten segments.

    Returns
    -------
    times : ndarray
        Centre time of each segment [s].
    energies : ndarray
        Mean squared value per segment.
    """
    x = np.asarray(x, dtype=float)
    N = len(x)

    if segment_duration is None:
        segment_duration = N / fs / 10.0
    seg_len = max(1, int(segment_duration * fs))

    n_segments = N // seg_len
    if n_segments == 0:
        return np.array([N / (2.0 * fs)]), np.array([np.mean(x**2)])

    x_trimmed = x[: n_segments * seg_len].reshape(n_segments, seg_len)
    energies = np.mean(x_trimmed**2, axis=1)
    times = (np.arange(n_segments) + 0.5) * seg_len / fs

    return times, energies